File:Vqn-fig2rev.png
From CAWSES

Size of this preview: 424 × 600 pixels
Full resolution (2,479 × 3,508 pixels, file size: 110 KB, MIME type: image/png)
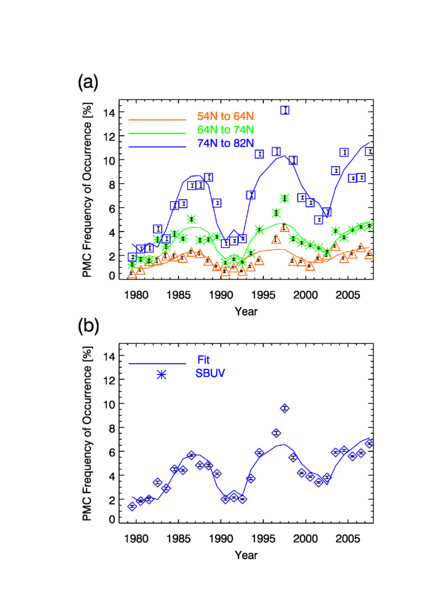
A comparison of the seasonal PMC frequency of occurrence measured by SBUV and the fit to a linear regres- sion in time and solar activity (upper panel) by latitude band and (lower panel) for all latitude bands combined between 54°N and 82°N. The error bars are the confidence limits in the individual seasonal mean values based on counting statistics, which do not reflect other factors such as inter-annual var- iability in large scale dynamics
File history
Click on a date/time to view the file as it appeared at that time.
(Latest | Earliest) View (newer 50) (older 50) (20 | 50 | 100 | 250 | 500)| Date/Time | Thumbnail | Dimensions | User | Comment | |
|---|---|---|---|---|---|
| current | 23:08, 19 March 2010 |  | 2,479×3,508 (110 KB) | Gary.thomas (Talk | contribs) | (A comparison of the seasonal PMC frequency of occurrence measured by SBUV and the fit to a linear regres- sion in time and solar activity (upper panel) by latitude band and (lower panel) for all latitude bands combined between 54°N and 82°N. The er) |
- Edit this file using an external application (See the setup instructions for more information)
File links
The following page links to this file:
