File:Rmr-timeseries.png
From CAWSES
Size of this preview: 515 × 600 pixels
Full resolution (889 × 1,035 pixels, file size: 142 KB, MIME type: image/png)
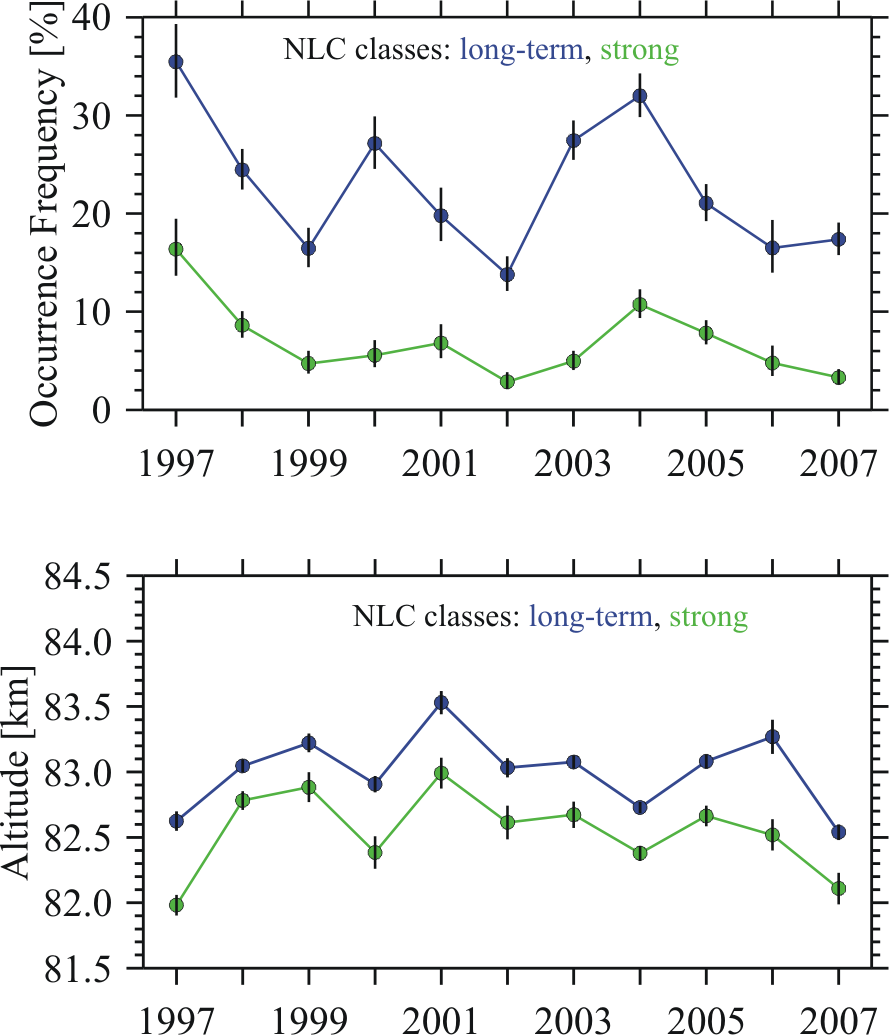
Fig. 2: Year-to-year variability of seasonal mean NLC occurrence and altitude for two different cloud classes. The blue curves contain all measurements having a sensitivity above the long-term detection limit, whereas the green curves show results for strong clouds only. The vertical bars indicate 95% confidence limits for the occurrence and errors of the mean altitudes. For more information see text and references.
File history
Click on a date/time to view the file as it appeared at that time.
(Latest | Earliest) View (newer 50) (older 50) (20 | 50 | 100 | 250 | 500)| Date/Time | Thumbnail | Dimensions | User | Comment | |
|---|---|---|---|---|---|
| current | 19:09, 24 April 2010 | | 889×1,035 (142 KB) | Gary.thomas (Talk | contribs) | (Fig. 2: Year-to-year variability of seasonal mean NLC occurrence and altitude for two different cloud classes. The blue curves contain all measurements having a sensitivity above the long-term detection limit, whereas the green curves show results for st) |
- Edit this file using an external application (See the setup instructions for more information)
File links
There are no pages that link to this file.
